17:05 ▪
4
min read ▪ by
That character gives chills and it’s no accident. Shiba Inu futures have seen a 666% explosion in their flows in a very short period of time. Behind this symbolic figure lies a much more nuanced market reality. Will SHIB’s bearish trend really turn around?
In short
- SHIB futures contract flows exploded by 666% in a short period of time, revealing intense speculative activity.
- SHIB price remains below its major moving averages in a still bearish chart structure.
- More than 531 billion SHIB were sent to exchanges in early March, adding to the selling pressure.
666%, a number that hides a much finer reality
This Thursday, March 5, 2026, market data shed light on a remarkable phenomenon: Shiba Inu futures contract flows saw a 666% increase over a short period of time.
This spectacular jump, almost symbolic in its numbers, signals a sudden wave of speculative positions around the famous dog-themed token. In short, traders rushed into the derivatives markets expecting a significant price move, up or down.
At the time, SHIB was trading around $0.0000056 with a slight intraday recovery. However, this rebound does not obscure the essential point: the chart structure remains deeply bearish. The price is still trading below its 50-day and 200-day moving averages, two trend lines that continue to the downside, confirming that sellers are still holding the reins tightly.
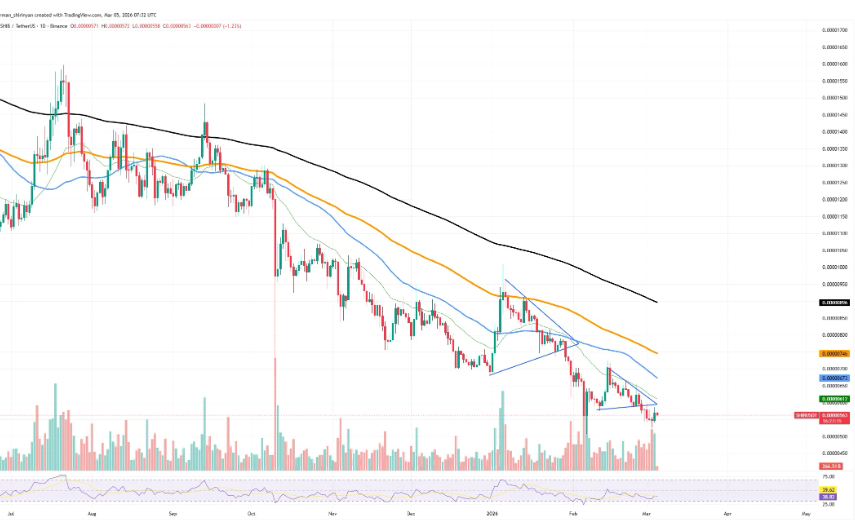
For several weeks, SHIB has formed a series of descending triangles on its chart. Each time the pattern resolved downward. The current configuration follows the same pattern: price is holding at the bottom of the structure, with no real upside momentum.
This technical context partly explains why derivatives markets are heating up: traders are hedging their bets ahead of what looks like a critical new test of support.
Added to this was a disturbing on-chain signal recorded in early March: more than 531 billion SHIB were then transferred to exchanges in barely 24 hours. Inflow volume significantly exceeding usual trends, often associated with a desire to sell rather than accumulate. In illiquid markets like weekends, this kind of movement can significantly amplify volatility.
Solid Bitcoin, Fragile SHIB: A Divergence That Speaks volumes
The comparison with Bitcoin is revealing. While SHIB is falling into a long-term bearish trend, BTC is showing a much firmer chart structure with momentum targeting $72,000 after consolidating around $63,000.
This divergence is not accidental: it illustrates the hierarchy of capital flows in uncertain times. Investors prefer to invest in the strongest asset, leaving speculative altcoins like SHIB behind.
For the Shiba Inu to regain momentum, Bitcoin would first need to sustainably stabilize above $72,000. This psychological level could create risk appetite and encourage the flow of capital into more volatile assets, especially memecoins. But we’re not there yet.
A 666% spike in futures flows confirmed that traders are closely watching SHIB, but watching does not mean buying. Until price regains its key moving averages and Bitcoin shows a signal of sustained acceleration, the Shiba Inu remains in the red zone. The next move will be decisive: a rebound or a final capitulation.
Maximize your Cointribune experience with our “Read and Earn” program! Earn points for every article you read and get access to exclusive rewards. Register now and start reaping the benefits.

I am passionate about Bitcoin, I love exploring the intricacies of blockchain and cryptocurrency and sharing my discoveries with the community. My dream is to live in a world where privacy and financial freedom are guaranteed for everyone, and I firmly believe that Bitcoin is the tool that can make this possible.
DISCLAIMER OF LIABILITY
The views, thoughts and opinions expressed in this article are solely those of the author and should not be taken as investment advice. Before making any investment decision, do your own research.